Detailed Design and Subsystem Test Stage
The third phase of the engineering and design process is the Detailed Design and Subsystem Test Stage. Whereas the previous stage generated the best concept and plan to achieve the requirements and desires of the project, this stage begins the actual design and implementation of those concepts. This includes the design and implementation of the fundamental components of the project on an individual level. Each small conglomerate of designs, referred to as a subsystem, is carefully and meticulous conceived, enacted, and then put to the test. After each individual component and subsystem undergoes an extensive series of testing on its own accord, it will become ready for the fourth and final stage of the design process, wherein all of the subsystems will be integrated and tested full scale.
Activities
- Came to a conclusion about a critical design decision that dictates how the project will implement graphing features (to be discussed in more depth, shortly).
- Full visualization of the Selection Scene (Index 1).
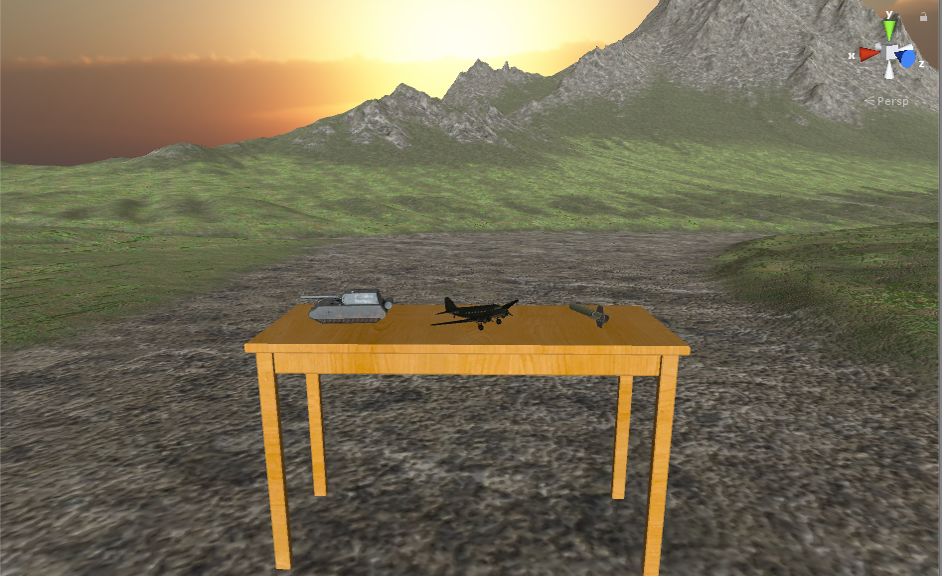
Image 1. The Fully Completed Visualization of the Selection Scene
- Full visualization of the Model and Test Type Scene (Index 2).
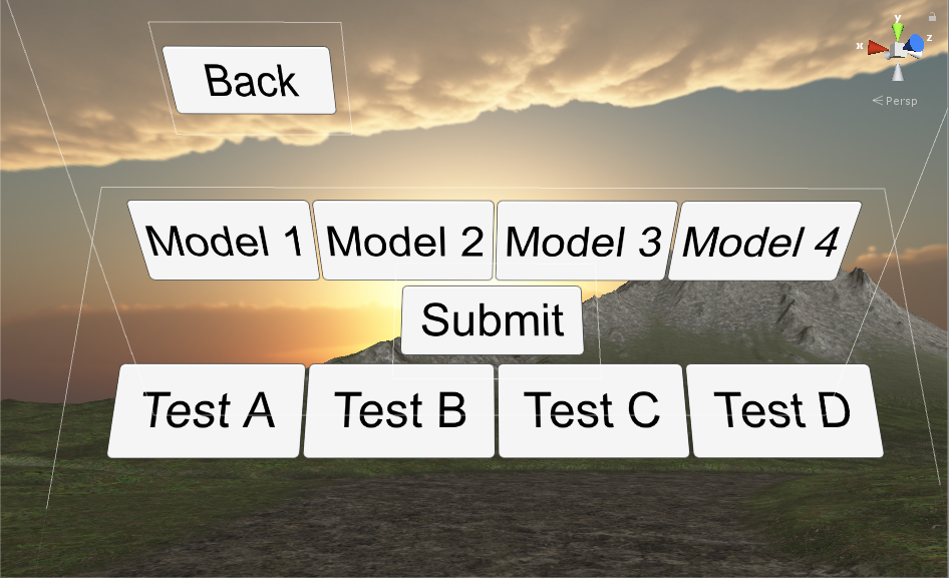
Image 2. The Fully Completed Visualization of the Model and Test Type Scene
- Full visualization of the Date Selection Scene (Index 3).
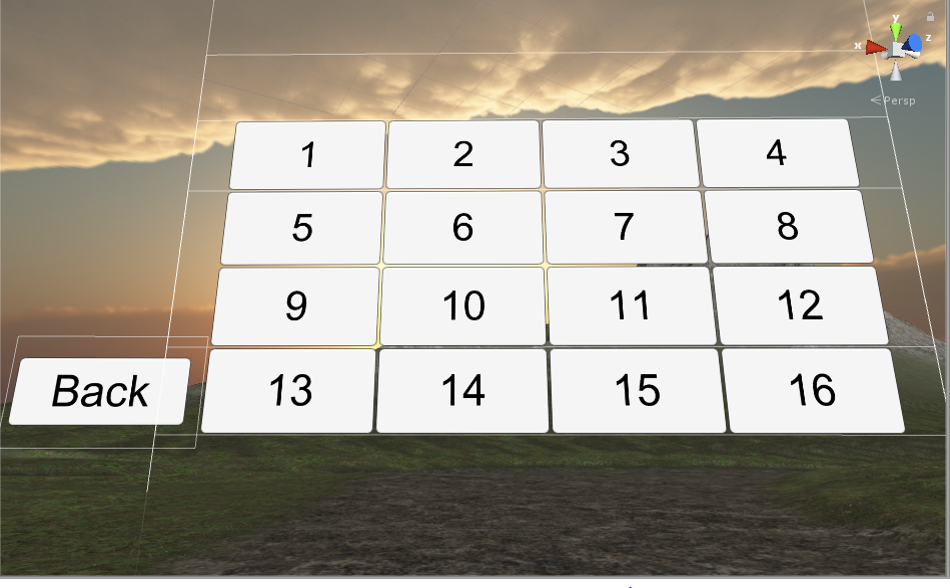
Image 3. The Fully Completed Visualization of the Date Selection Scene
- Full visualization of the Graph Scene (Index 4).
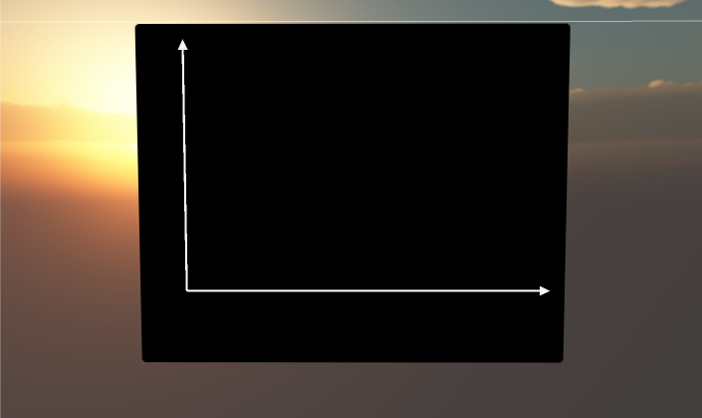
Image 4. The Fully Completed Visualization of the Graph Scene
- Full, functional navigation between all menus and scenes.
- Full motion integration on non-graphing scenes
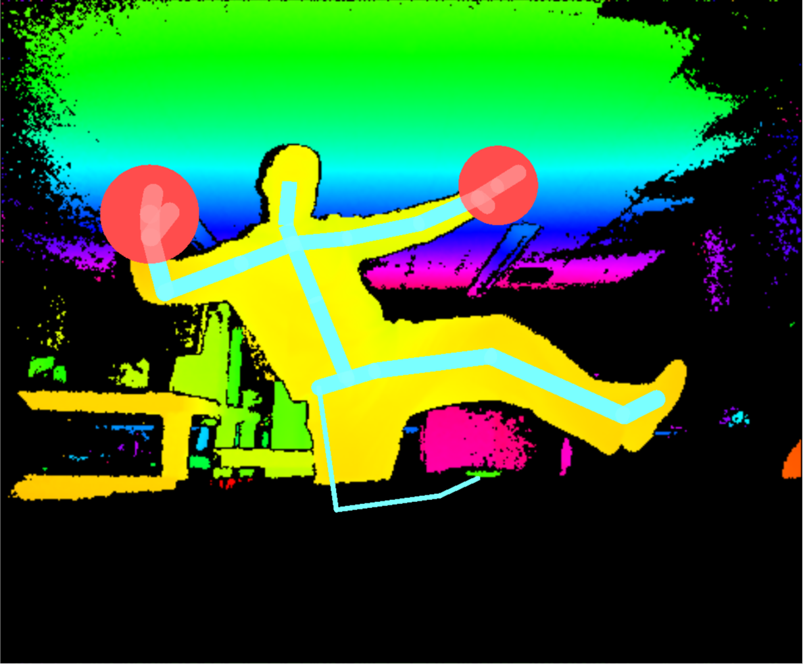
Image 5. A Hardworking Team Member Tests the Kinect's Motion Tracking Capabilities
- Minor research and progress made into data importation and mobile application development (significant enough to note, yet not substantial enough to provide further information, yet).
- Produced multiple deliverables and assignments to Dr. David Scott and Dr. Elmer Grubbs, for the successful completion of the EE486C Capstone course.
Milestones
Milestones Explained: What This Means For The Project
As of right now, all visuals for the project have been fully created and tested. What this means is that the virtual environment that the user will experience, navigate through, and interact with, have all been created and refined to be as intuitive and as aesthetically pleasing as possible. Additionally, the user is able to fully navigate to any scene that he or she desires. Namely, the user can go to the next scene, remain in their current scene, or return to the previous scene, all via menu navigation. Finally, the user is able to perform these transitions between each scene via their physical movements. Thus, the user is able to reach out and "grab" the item that they would like to select, and it will trigger the desired action to occur. As of right now, this sums up the progress of the project, in its entirety.
- Completed full visualization of the entire project.
- Fully integrated motion controls in all aspects of the project, excluding graphing manipulation.
- Finalized hardware and software selection for this project.
- Selection Scene Visuals Testing - Completed.
- Model and Test Scene Visuals - Completed.
- Data Selection Scene Visuals - Completed.
- Graph Scene Visuals - Completed.
- Motion Controls and Menu Navigation Testing - Completed.
- Produced two large deliverables for the client, as well as the EE476C course, including:
Milestones Explained: What This Means For The Project
As of right now, all visuals for the project have been fully created and tested. What this means is that the virtual environment that the user will experience, navigate through, and interact with, have all been created and refined to be as intuitive and as aesthetically pleasing as possible. Additionally, the user is able to fully navigate to any scene that he or she desires. Namely, the user can go to the next scene, remain in their current scene, or return to the previous scene, all via menu navigation. Finally, the user is able to perform these transitions between each scene via their physical movements. Thus, the user is able to reach out and "grab" the item that they would like to select, and it will trigger the desired action to occur. As of right now, this sums up the progress of the project, in its entirety.
Tools
This stage utilized all tools that had previous been employed by the project. Specifically, it utilized Microsoft Office Tools (Word and PowerPoint for documentation and presentations), Google Services (Gmail and Google Drive for communication and collaboration), the Microsoft Kinect SDK (for motion tracking and gesture control), Unity Engine in C# (for creating the virtual environment), a Microsoft Kinect, an Oculus Rift Development Kit 2 Virtual Reality Headset, and a Computer.
In addition to the previously employed tools, one design decision during this stage (to be discussed in the following section) led to the utilization of one new tool:
Unity assets are pre-built tools, made by independent Unity developers and coders. The purpose of these assets is to sell or give to other Unity developers, with the intent of accomplishing a commonly needed task. Assets can range from meshes and prefabs of commonly used items (cars, guns, trees, etc.), to sound clips (bird chirps, music, etc.), to in-game tools (such as the Graph Maker tool, referenced above).
This stage utilized all tools that had previous been employed by the project. Specifically, it utilized Microsoft Office Tools (Word and PowerPoint for documentation and presentations), Google Services (Gmail and Google Drive for communication and collaboration), the Microsoft Kinect SDK (for motion tracking and gesture control), Unity Engine in C# (for creating the virtual environment), a Microsoft Kinect, an Oculus Rift Development Kit 2 Virtual Reality Headset, and a Computer.
In addition to the previously employed tools, one design decision during this stage (to be discussed in the following section) led to the utilization of one new tool:
- Graph Maker, by Stuart S. (Unity Asset)
Unity assets are pre-built tools, made by independent Unity developers and coders. The purpose of these assets is to sell or give to other Unity developers, with the intent of accomplishing a commonly needed task. Assets can range from meshes and prefabs of commonly used items (cars, guns, trees, etc.), to sound clips (bird chirps, music, etc.), to in-game tools (such as the Graph Maker tool, referenced above).
Design Decisions
During this design phase, only one design decision was made, but it was an extremely critical one. Specifically, the team came to a conclusion about how they would implement and display graphs within the project.
Initially, the team conducted quite a bit of research into the process of graphing with particle systems. This interesting methodology would provide exciting, engaging two dimensional and three dimensional graphs for the user to see. However, the team had concerns about topics such as: modifying the graphs, including axes, including data points, labeling the axes and titles, etc. Because of these rather large concerns, the team decided to make an alternative design decision.
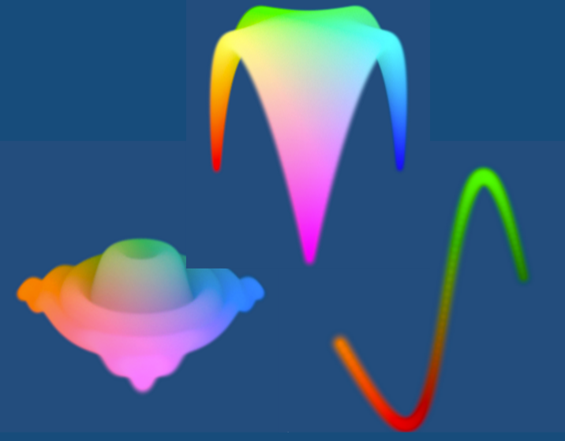
Image 6. Some 2D and 3D Functions, Graphed Via Particle Systems
The alternative design decision, then, was to use a built in Unity asset, called Graph Maker. Produced by Unity publisher Stuart S., Graph Maker is capable of producing graphs in an aesthetic, easy-to-read fashion. This display of graphical data includes data points, axes, labels, and tick marks, among other critically useful components. With this asset, the team no longer needs to dedicate a great deal of time and effort into performing some of the more tedious tasks, such as making axes or labels. Instead, the team may dedicate their efforts into integrating motion controls into modifying the graphs, the original problem definition of the project.
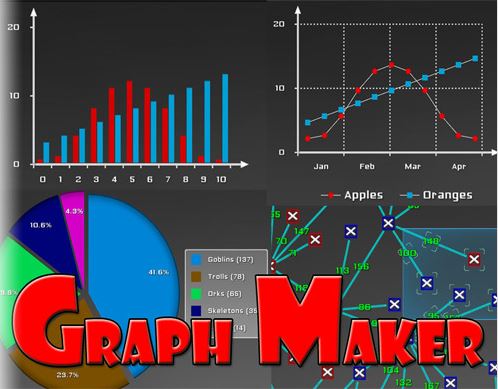
Image 7. A Display of Stuart S.'s Graph Maker Asset
Design Work
During this stage, there was no analysis or simulations that occurred. However, if one were to deem each visual scene to be a "build", then multiple scene builds were produced and implemented (as visible in the "Activities" section, above).
Additionally, during this phase, one tool was selected for use and implementation in the project. Specifically, the Graph Maker Unity Asset, as described and justified in more detail in the preceding section.
Other than these two minor components, no other items that may be classified as "Design Work" occurred. However, this may simply be due to the heavily software oriented nature of the project, in that there are no simulations or analysis.
Testing
As the name of this stage may imply, this third design phase includes a great deal of smaller, individual subsystem testing. Although not a part of the entire, integrated, final project, the testing that occurred on these subsystems will ensure that each individual component is fully functional, before it is combined in the final product. Below is a list of testing that has been fully completed, including the team member that was responsible for such testing.
Because this is an almost exclusively programming and software based capstone project, we ask that special consideration be given when examining the testing utilized to ensure the project is working. Due to the nature of the project, testing is almost constant. Whereas other projects may require a good amount of effort to set up a test, run it, and make note of the results, testing of a software based program can be done instantaneously. A small amount of code may be written before it is compiled and “tested” to see if it runs properly, all in the span of mere minutes. Because of the simple and instantaneous nature of being able to test and debug the code, the result is that the program may be “tested” hundreds of times a day. For the sake of this report, the dozens to hundreds of compilations of the code that are tested each day have been clumped together, based on desired outcome of the testing. This provides a concise, neat way to summarize the numerous daily “micro-tests”. The title of the test category is provided, followed by the team member responsible and a concise summary of the purpose of the testing. Although these tests may seem informal, the nature of the project dictates that this is how testing is conducted, for the most part.
Selection Scene Visuals – John Miscevich
The Selection Scene is the first part of the project that a user will see. During this scene, the user selects either the missile, the tank, or the plane. This first group of testing consists solely of developing the visual layout of this first virtual environment. This large grouping of tests consists of over hundreds of sub-tests whose sole purpose is to see if the environment looks “right” to the user. In fact, most of these tests tend to last between 5 and 20 seconds. To perform this test, one or both team members (depending on who is available and who is responsible for testing) will compile and run the code while wearing the Oculus Rift DK2. They will then look at all of the aspects of the virtual environment and make note of what to change. Because virtual reality is so heavily influenced by visuals and perspectives, this is an incredibly critical point. Some examples may include: noting that the table the items are set on is too large, the lighting on the items is not adequate, a particular item looked better as one color than another, the items are not rotating properly, and many other visual considerations. Once something that is visually displeasing is noted, the code is modified and then retested. This process repeats itself indefinitely, until the virtual environment has achieved the desired look.
Model and Test Scene Visuals – Liam Burke
As with the previous selection scene, hundreds of “micro-tests” are done to ensure that the virtual environment looks in such a way that it can be easily interacted with by the users (nothing is too confusing, everything is intuitive to use, nothing makes the user nauseous, etc.). Hence, much of the testing consisted of placing a menu item into the virtual environment, running the code while wearing the Oculus DK2, and analyzing the surrounding area. If an item that was placed into the world was aesthetically pleasing, it was kept in its position and new components were added. If an item was not displaying in a desirable way, the code was changed and retested. Once again, this process was repeated until the environment looked as desired.
Date Selection Scene Visuals – Liam Burke
Once the Model and Test Scene had been created, developing the Date Selection Scene was simply a matter of using the Model and Test Scene as a template. The same items from the Model and Test Scene were recycled, renamed, or slightly repositioned to create the Date Selection Scene. However, the Date Selection Scene did undergo the same testing process as the previous two scenes. A vigorous cycle of “write code, compile, analyze visuals, repeat” was utilized until everything looked as it should.
Graph Scene Visuals – John Miscevich
In a similar fashion to all other visuals testing, testing the Graph Scene consisted of dozens, if not hundreds, of recompiles and live tests. Some tests include repositioning the camera, repositioning the graphical data, and modifying the canvas that the graph was displayed on. Once again, there was a constant, continuous cycle of recoding and retesting until the Graph Scene displayed how both team members wanted it.
Motion Controls Testing – John Miscevich
Once all of the scenes had been created, the next phase of the project was to begin integrating motion controls via the Microsoft Kinect. This was an extensive trial and error process of coding for the Microsoft Kinect, including it in Unity, and seeing how the project would respond. To adequately test this, two small spheres were placed within the virtual world. C# scripts were then coded and attached to the spheres to track the motion of the user’s two hands. Among the numerous constant recompilations, some of the more common errors that needed to be addressed included: repositioning the spheres in the virtual world, the Kinect not properly tracking the user’s hands, debugging problems in the code, resolving syntax errors, and recoloring and resizing the spheres. These numerous sub-tests were all accomplished with the purpose of being able to track the user’s physical movements within the virtual world.
Challenges
During this phase, the team was fortunate enough to not encounter any significant challenges that would fall outside the realm of difficulties usually associated with coding and programming. This, of course, includes the usual array of bugs, syntax errors, and miscalculations, among other things.
Some minor (yet noteworthy) challenges included organizing the virtual environments (scenes) in such a way that they were not only visually and aesthetically appealing, but also so that, from a perspective standpoint, they made sense to the user. Another challenge was getting the motion tracking of the Microsoft Kinect to be visualized and displayed on screen, an issue which was easily and quickly resolved by representing the user's hands as spheres in the virtual environment.
